General information about GDOES
Glow Discharge Optical Emission Spectrometry (GDOES) is a spectrometric method for the qualitative and quantitative analysis of metallic and non-metallic solid materials.
GDOES allows for the investigation of the elemental composition as well as the layer thickness and layer structure of a sample. Moreover, coating weights can be determined.
The thickness of analysable layers ranges from thin layers (< 50 nm) to thick layers (several hundred μm). Possible sample materials include metals, semiconductors, glass, ceramics and polymers.
The Glow Discharge Source
The Glow Discharge Source is a Grimm type discharge tube characterized by a special arrangement of the electrodes: The two electrodes of the DC Current Source are set up of a cylindrical hollow anode and a cathode. The sample is placed directly onto the cathode and hence, is switched as cathode itself. The sample must seal the anode tightly so a vacuum can be generated (Figure 1). Thus, a flat and preferably smooth sample surface is required.
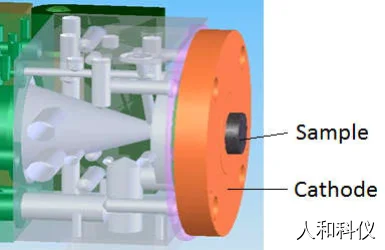
Figure 1. Schematic presentation of the Glow Discharge Source. The sample seals the anode tightly.
For the analysis of curved and/or small samples Spectruma Analytik developed the so-called Universal Sample Unit: Without further preparations the sample is placed into fitting adaptors and sealed with a plastic cap enabling the generation of a vacuum.
Usually, Argon is used as plasma gas. But alternative gases like neon or a mixture of argon and hydrogen are available, too.
Simplified principle of GDOES (for electroconductive materials)
The sample is placed into the Glow Discharge Source and switched as cathode. The Glow Discharge Source is filled with argon gas under low pressure. Direct Voltage is applied between a hollow anode and the cathode (≙ sample). Due to the energy input of the DC voltage the argon atoms are ionised resulting in the formation of a plasma.
Argon cations are accelerated towards the negative sample surface and knock out some sample atoms (“sputtering process”). The knocked out sample atoms diffuse into the plasma where they collide with high-energy electrons. During these collisions energy is transferred to the sample atoms promoting them to excited energy states. Returning to the ground state, the atoms emit light with a characteristic wavelength spectrum (Figure 2).
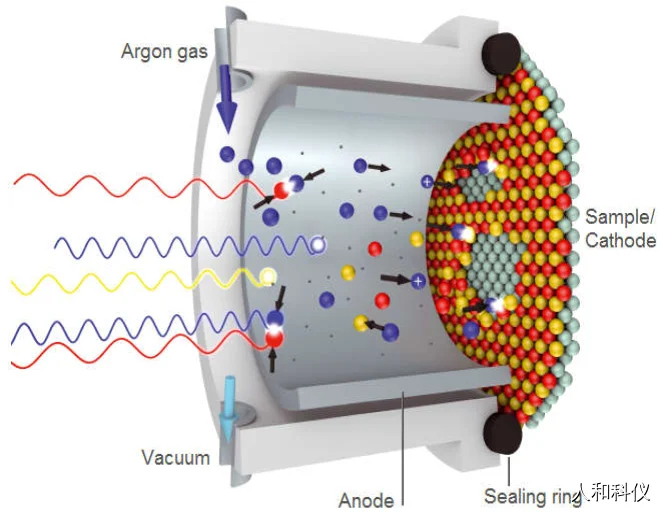
Figure 2. Sputtering process in the Glow Discharge Source. Yellow/red spheres: sample atoms; blue spheres: argon atoms or cations
In the spectrometer the light is dispersed into its spectral components, which are registered by the detection system. The intensity of the lines is proportional to the concentration of the corresponding element in the plasma.
For the analysis of insulating samples Radio Frequency (RF) is applied. The RF-generator by Spectruma Analytik can be operated in continuous mode or in pulsed mode. The conditions in the plasma are stable within a few milliseconds. Performing an analysis in the pulsed mode results in a better resolution of ultrathin layers (in the range of few nanometres). Moreover, the pulsed mode offers gently measurements of heat-sensitive samples due to a lower energy input.
The sample atoms are removed parallelly to the surface, so the sample is analysed layer by layer. Applying the right conditions results in the formation of flat measuring spots on the samples (Figure 3).
Since the erosion rates range within several nanometres per second, measurements usually take only few minutes.
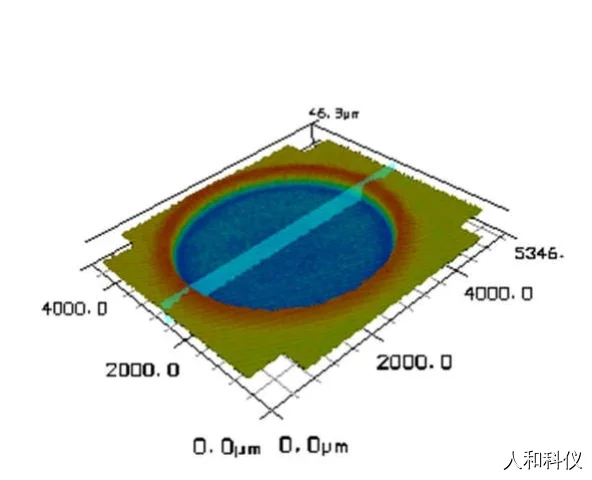
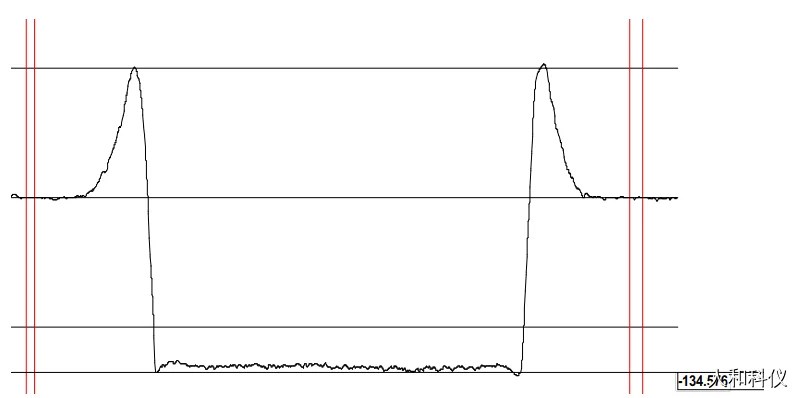
Figure 3. 3D-display (left) and cross section (right) of a typical measuring spot (here: 134 μm).
Detection
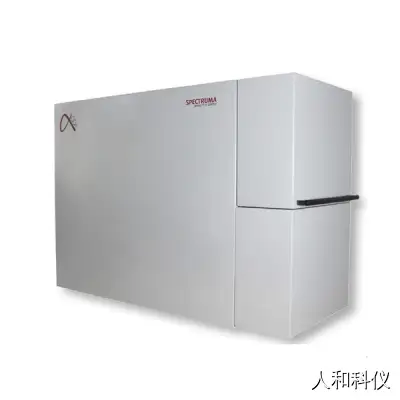
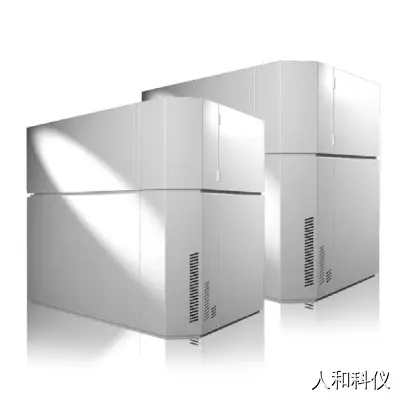
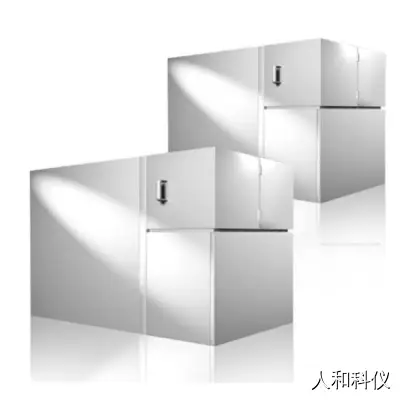
Depending on the instrument type (Figure 4) samples can be analysed by Photomultiplier optics (PMT) or Charge-Coupled Device optics (CCD).
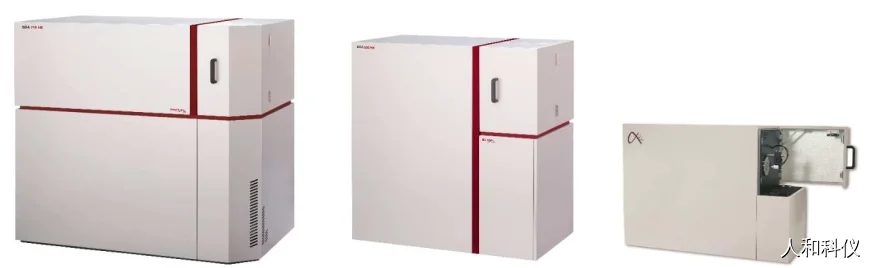
Figure 4. From left to right: GDA 550 HR / 750 HR with PMT, GDA 150 HR / 650 HR and GDA-Alpha with CCD
The high resolution CCD optics offer an unparalleled flexibility concerning the choice of element channels. The advantage of the PMT optics resides in the particularly low detection limits, which is especially important when analysing ultrathin layers (<50 nm).
Instrument settings
Sample / Matrix: Fuel Cell; four different layers on NiO base
Sample preparation: none
Instrument: GDA-Alpha ☐ Anode diameter: 1 mm ☐
GDA 150 HR ☐ 2.5 mm ☒
GDA 650 HR ☐ 4 mm ☐
GDA 550 HR ☐ 8 mm ☐
GDA 750 HR ☒
Description: PMT detection ☒ RF measurement ☐
CCD detection ☒ DC measurement ☒
Universal sample unit ☐
Test procedure: Bulk analysis ☐
Depth profile analysis ☒
The spectrometer has been calibrated using certified reference materials (CRM). Measurements are performed according to ISO14707, ISO25138:2010 and ISO/DIS16962.2 (ISO/TC 201/SC 8), whenever those are applicable.
Task
Depth profile analyses of a fuel cell with four different coatings were performed using the DC-mode, applying 12 mA (const.) and 1000 V (Figure 5). The diameter of the anode was 2.5 mm.
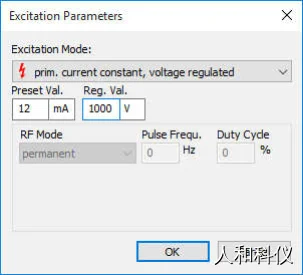
Figure 5. Excitation parameters
Figure 6 shows the sample with burning spots. All measurements are marked with one to three points. One point corresponds to measurement (I) etc. So the positions of the measurements on the sample can be tracked.
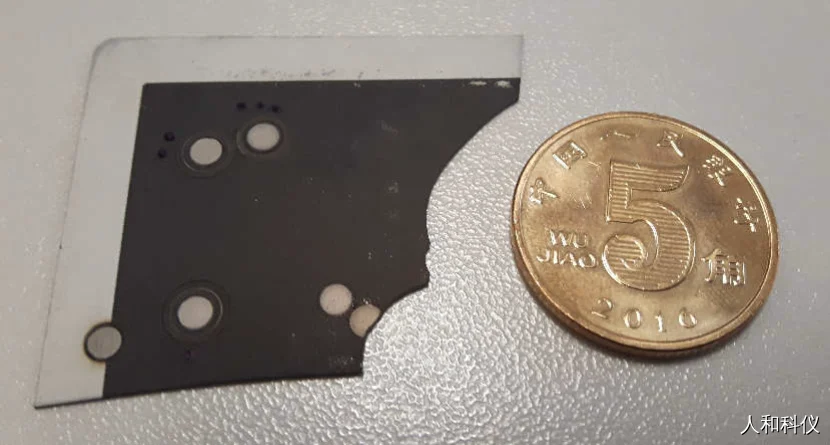
Figure 6. Sample with burning spots beside a 5-Wu-Jiao-coin for size comparison
To find the best plasma parameters, several tests were performed, including tests with radio frequency (RF) excitation, tests using a special cap, and tests with a very small anode. The best results were obtained when analysing in the DC-mode with the standard 2.5-mm-anode.
Due to the very high surface roughness of the sample, nitrogen from the ambient air was sucked into the anode during analysis. As a result, a nitrogen-argon-mix formed in the plasma. A large amount of nitrogen can have a significant impact on the intensities, and thus, on the calculated mass concentrations. So no reliable quantification is possible and we decided to present a semi-quantitative depth profile instead, plotting intensities versus depth. Figure 7 shows the semi-quantitative depth profile of the sample.
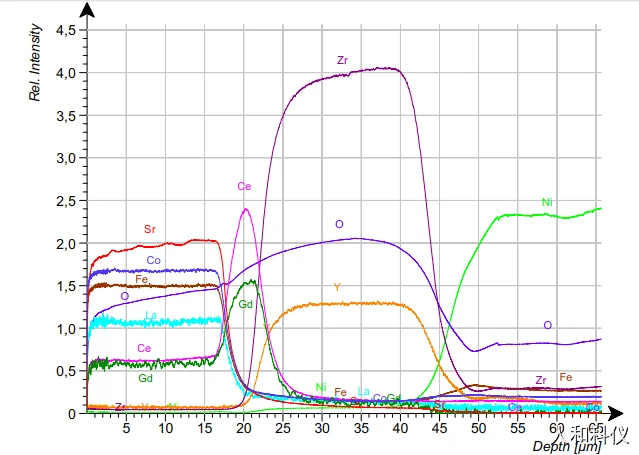
Figure 7. Semi-quantitative depth profile of fuel cell (measurement I)
To confirm the (total) coating thickness of the first three layers, we stopped one measurement before the Ni-containing layer was sputtered, and then measured the depth of the resulting crater with a profilometer.
Figure 8 shows the profilometer image of analysis (III). Displaying a depth of about 45 μm, the result of the profilometer analysis is in excellent agreement with the value calculated by the software. The sharp crater profile with a flat crater bottom proves that the selected plasma parameters are good.
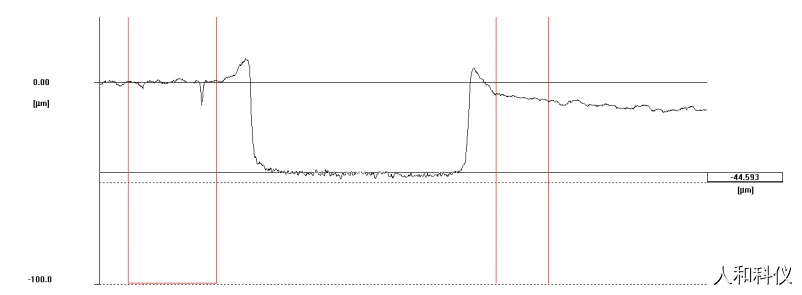
Figure 8. Crater profile of analysis (III) obtained by a profilometer
As just explained above, the total thickness of the first three layers was cross-checked by a profilometer. Since it can be assumed that the sputtering rate of the different layers does not change, the ratio of the layer thicknesses is most likely correct.
The thicknesses according to that assumption are:
- 17 μm for the first layer [La0.6Sr0.4Co0.2Fe0.8O3+δ/(Ce0.9Gd0.1)O1.95]
- 5 μm for the second layer [(Ce0.9Gd0.1)O1.95]
- 21 μm for the third layer [(Y2O3)0.08(ZrO2)0.92]
The first two thicknesses are in very good agreement with the thicknesses obtained by SEM. The Zr-containing layer (21 μm) in the graph could also be interpreted as the sum of the third and fourth layers.
Figures 8 to 18 show overlay curves of three measurements of the fuel cell.
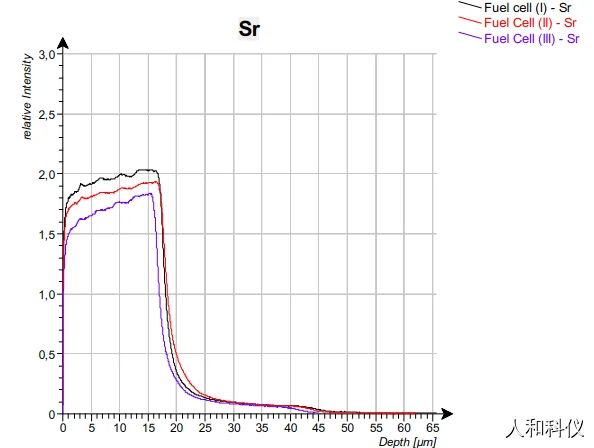
Figure 9. Overlay of three measurements of the fuel cell; strontium
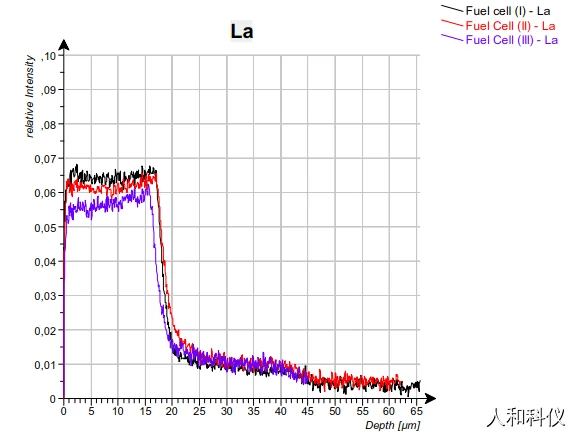
Figure 10. Overlay of three measurements of the fuel cell; lanthanum
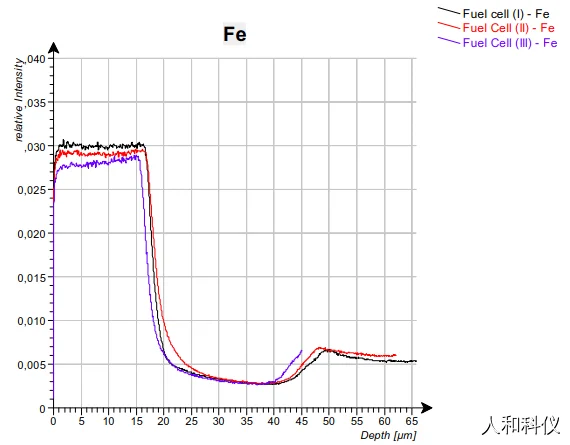
Figure 11. Overlay of three measurements of the fuel cell; iron
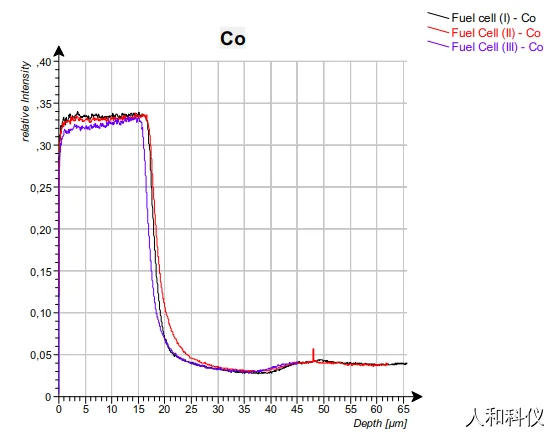
Figure 12. Overlay of three measurements of the fuel cell; cobalt
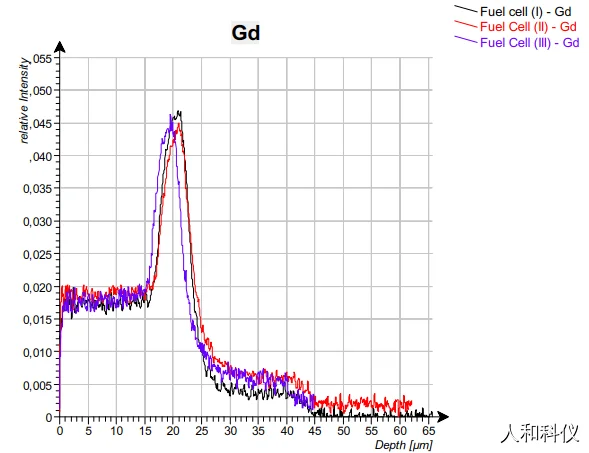
Figure 13. Overlay of three measurements of the fuel cell; gadolinium
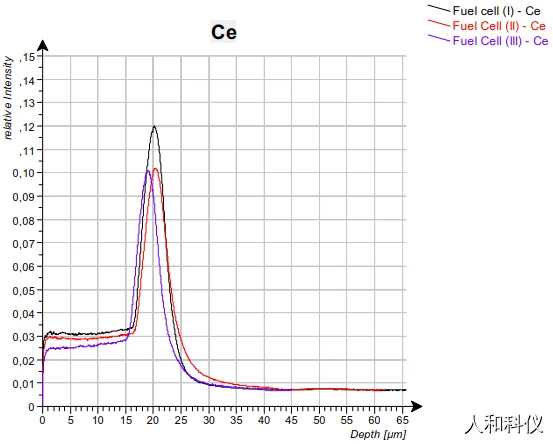
Figure 14. Overlay of three measurements of the fuel cell; cerium
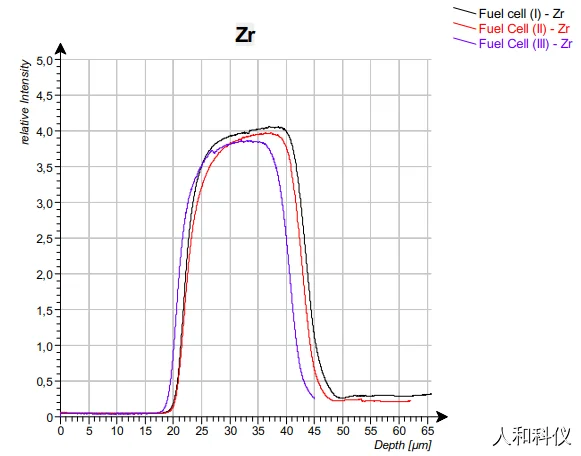
Figure 15. Overlay of three measurements of the fuel cell; zirconium
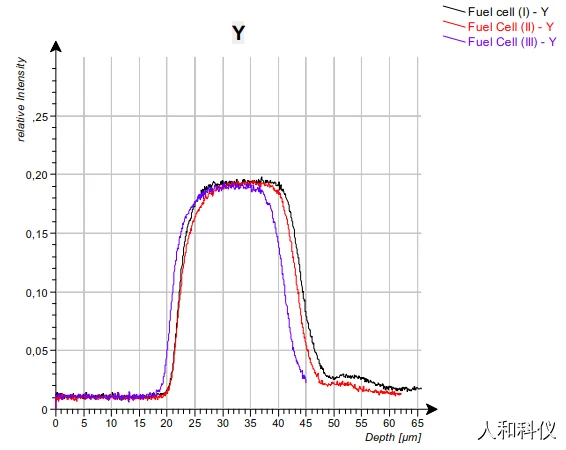
Figure 16. Overlay of three measurements of the fuel cell; yttrium
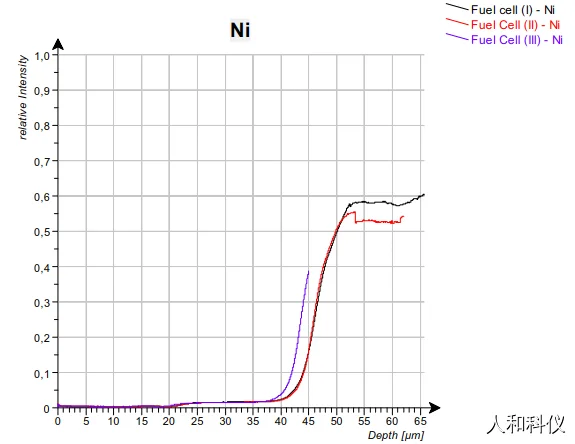
Figure 17. Overlay of three measurements of the fuel cell; nickel
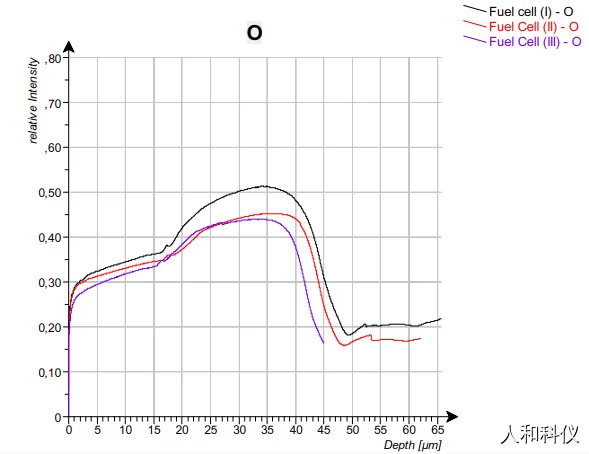
Figure 18. Overlay of three measurements of the fuel cell; oxygen
The reproducibility is relatively good, especially considering the high surface roughness of the sample.
The measurements presented in this report were performed with a GDA 750 HR. Fuel cells can easily be analysed by a GDA-Alpha, too. The GDA-Alpha is smaller and has no automatic cleaning reamer (instead, a manual cleaning unit is used for cleaning the anode). But it contains a very powerful high-performance CCD and can yield as good and reliable results as the bigger instruments.
GDOES enables its users to compare layer thicknesses and also compositions of fuel cells quickly and easily. Even in the semi-quantitative view as presented in this report it is easy to see if one fuel cell contains more/less of a certain element than another, or if one layer is thicker/thinner. No laborious sample preparation is required, and compared to other techniques GDOES is much faster.
上海人和科学仪器有限公司
联系方式:4008-200-117
网址:www.renhe.net
详细资料欢迎联系:
吴经理:13918294437
邮箱:info@renhesci.com